‘What-if Analysis’ is an option that allows you to change the values in cells to see how the result would have changed due to the formulas computing this new values.
There are three ‘What-if’ tools:
- Scenario Manager
- Goal Seek
- Data Table
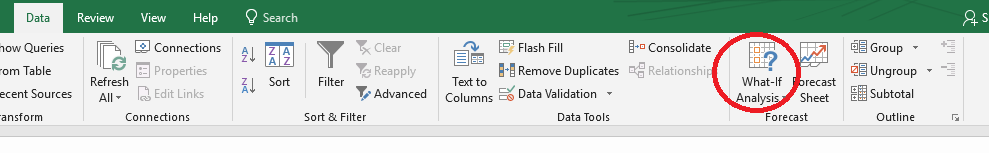
Where to find the ‘What-if Analysis’ option?
Go to the ‘Data’ menu. You can now see the ‘What-if Analysis’ option towards the right hand side in the ‘Forecast’ group.
Scenario Manager in Excel
This option can be used when you have a scenario like a company accounts report and you want to see how the scenario will change if one of the values of the scenario is changed.
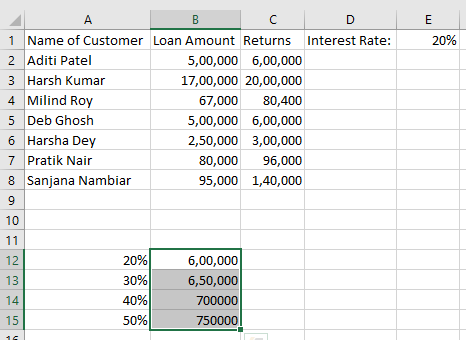
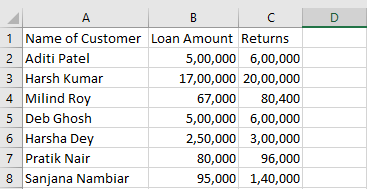
Supposing, Rahul runs an insurance agency where the usual interest rate is 15%. This is a list if some of his clients who borrowed loans this month with the amount they have to return according to this interest.
 Now, he wants to see how this would have changed had the interest rate been 20%.
To do this,
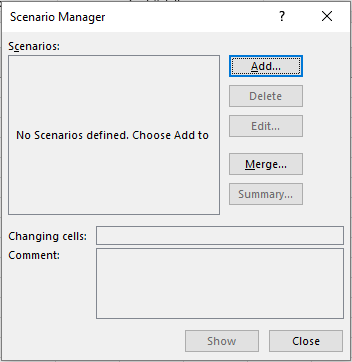
Click on the ‘What-if Analysis’ option in the ‘Forecast’ group of ‘Data’ menu and select ‘Scenario Manager’ from the dropdown list. The following dialogue box will appear.
Click on ‘Add’ and then click on ‘Show’. The following box will appear.
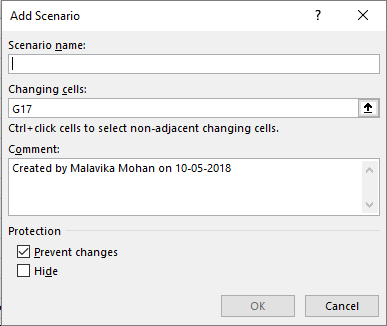 Now enter a name for the scenario in the ‘Scenario Name’ textbox as ‘20% Interest Rate’. Change the cells in the ‘Changing cells’ box if necessary. Click on ‘Ok’ once you are done.
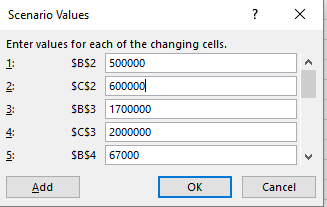
Enter the new values according to the scenario you want in the relevant textboxes and press ‘Ok’.
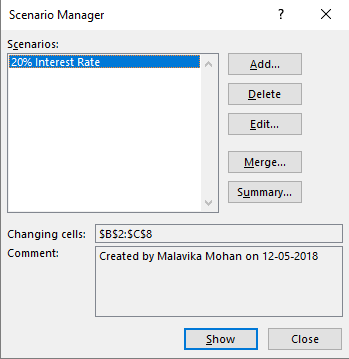
Now the Scenario Manager dialogue box will be opened again. Select the Scenario ‘20% Interest Rate’ and then click on ‘Show’.
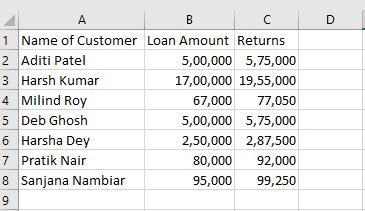
The value will be changed in the cell and you can see the consequences as follows.
Goal Seek in Excel
Suppose Rahul has used formulas to compute these returns. Now that he has got the result for what the payable amount by the customers would have been with a different interest rate, he want to see how this would have changed if the principle amount was different. He can do this by performing the following steps.
Go to the ‘Data’ menu and then click on the ‘What-if Analysis’ option. A dropdown list as follows will appear.
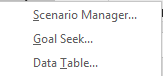 Now choose ‘Goal Seek’ option. The following dialogue box will appear.
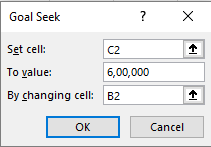
In the ‘Set cell’ textbox enter the cell that you want the new value in. ‘To value’ textbox should contain the new value and in the ‘By changing cell’ box enter the cell, by changing the value of which the value of the cell in ‘Set Cell’ will change by default. Make sure that you select cells that have formulas applied to them.
Press ‘Ok’ once you are done.
Rahul will receive the following result for his selected cell.
![]()
The following dialogue box explaining this result will also appear.
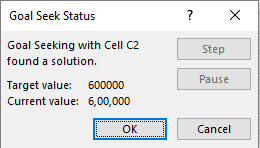 Press ‘Ok’ to continue.
Data Table in Excel
Suppose Rahul wants to calculate the same operation for multiple values. In such a situation, he can use the ‘Data Table’ option.
He should select the first cell in his data table and enter ‘=E1’ and then type consequent percentages in the rows that follow. After this, he should enter ‘=C2’ in the adjacent cell.
Then, he should click on the area where he would like the data table to be inserted and then click on the ‘Data Table’ option in the dropdown list of ‘What-if Analysis’. The following dialogue box will appear.
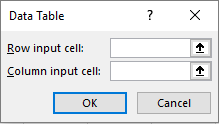
Enter the reference cells for the row and column of the data table respectively. Press ‘ok’ once you are done.
Your data table will be created.