Aanchal discovered the ‘SmartArt Graphic’ option in Excel recently and she confused it with Charts.
What is the difference between the two?
While Charts can be used to depict numerical data in an eye-catching manner, SmartArt Graphics can be used to represent textual information attractively.
The various SmartArt Graphics available are:
- List
- Process
- Cycle
- Hierarchy
- Relationship
- Matrix
- Pyramid
- Picture
Each one of these is used for different purposes as is later described.
Having learnt this, she decides to use this for her school projects but does not know how to. These are the steps she should follow to do so.
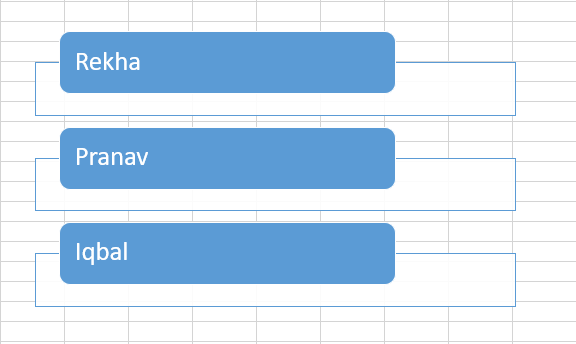
List
As the name suggests, this SmartArt graphic is used to represent a list of items for example names of products, people, brands, etc. To insert a list, Aanchal should click on the ‘SmartArt Graphic’ icon from the ‘Illustrations’ group in the ‘Insert’ menu. The following dialogue box will appear.
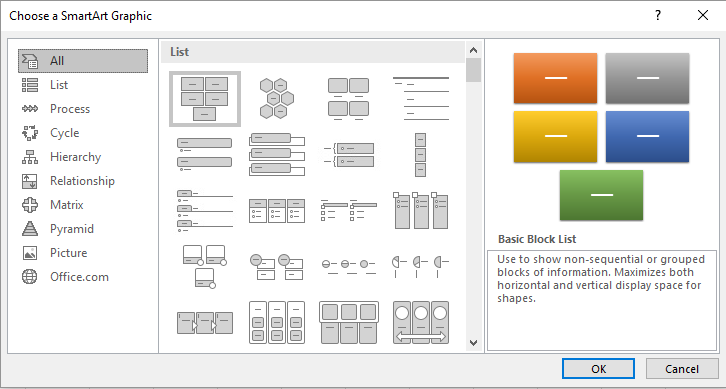 She can select the ‘List’ option from the options given on the left-hand side and choose one of her choice from the different types that will be displayed in the centre pane. She should press ‘OK’ once she is done. She can now manually type her text onto the SmartArt Graphic inserted.
Here is what one may look like.
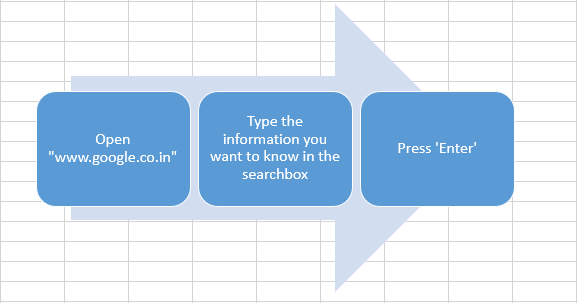
Process
A ‘Process’ graphic is used to represent the procedure of something for example the baking of a cake, finding something on the web etc. To insert a ‘process’, Aanchal should click on the ‘SmartArt Graphic’ icon from the ‘Illustrations’ group in the ‘Insert’ menu. The following dialogue box will appear. She can select the ‘Process’ option from the options given on the left-hand side and choose one of her choice from the different types that will be displayed in the centre pane. She should press ‘OK’ once she is done. She can now manually type her text onto the graphic inserted.
Here is what one may look like.
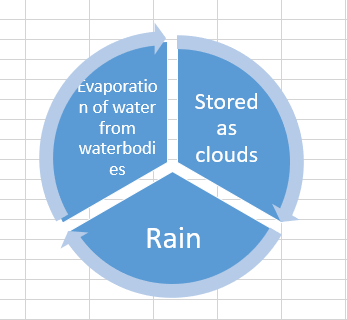
Cycle
A ‘Cycle’ graphic is used to represent a cyclical events of things for example the photosynthetic cycle. To insert a cycle, Aanchal should click on the ‘SmartArt Graphic’ icon from the ‘Illustrations’ group in the ‘Insert’ menu. The following dialogue box will appear. She can select the ‘Cycle’ option from the options given on the left-hand side and choose one of her choice from the different types that will be displayed in the centre pane. She should press ‘OK’ once she is done. She can now manually type her text onto the graphic inserted.
Here is what one may look like.
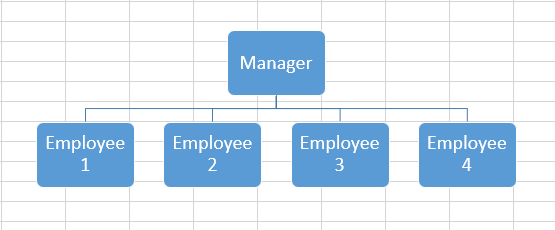
Hierarchy
A ‘Hierarchy’ graphic is used to represent the relative positioning of things for example the hierarchical placement of an institution. To insert a Hierarchy, Aanchal should click on the ‘SmartArt Graphic’ icon from the ‘Illustrations’ group in the ‘Insert’ menu. The following dialogue box will appear. She can select the ‘Hierarchy’ option from the options given on the left-hand side and choose one of her choice from the different types that will be displayed in the centre pane. She should press ‘OK’ once she is done. She can now manually type her text onto the graphic inserted.
Here is what one may look like.
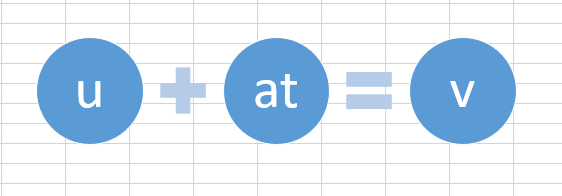
Relationship
A ‘Relationship’ graphic is used to represent the relations between people for example between various values or variables. To insert a Relationship, Aanchal should click on the ‘SmartArt Graphic’ icon from the ‘Illustrations’ group in the ‘Insert’ menu. The following dialogue box will appear. She can select the ‘Relationship’ option from the options given on the left-hand side and choose one of her choice from the different types that will be displayed in the centre pane. She should press ‘OK’ once she is done. She can now manually type her text onto the graphic inserted.
Here is what one may look like.
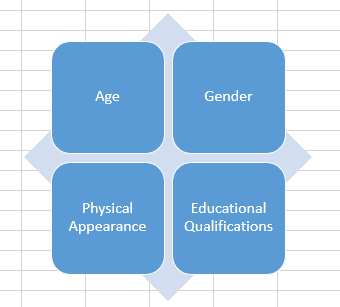
Matrix
A ‘Matrix’ graphic is used to represent the various conditions of a system for example of the society, for a formula to be true, etc. To insert a matrix, Aanchal should click on the ‘SmartArt Graphic’ icon from the ‘Illustrations’ group in the ‘Insert’ menu. The following dialogue box will appear. She can select the ‘Matrix’ option from the options given on the left-hand side and choose one of her choice from the different types that will be displayed in the centre pane. She should press ‘OK’ once she is done. She can now manually type her text onto the graphic inserted.
Here is what one may look like.
Pyramid
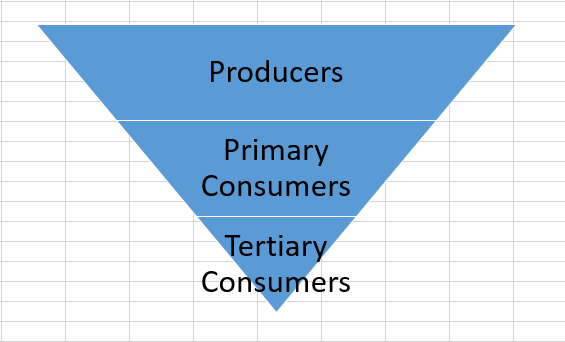
A ‘Pyramid’ graphic maybe used for various purposes, like to show different proportions of items in a group, interrelation, hierarchy, etc.the baking of a cake, finding something on the web etc. To insert a pyramid, Aanchal should click on the ‘SmartArt Graphic’ icon from the ‘Illustrations’ group in the ‘Insert’ menu. The following dialogue box will appear. She can select the ‘Pyramid’ option from the options given on the left-hand side and choose one of her choice from the different types that will be displayed in the centre pane. She should press ‘OK’ once she is done. She can now manually type her text onto the graphic inserted.
Here is what one may look like.
Picture
A ‘Picture’ graphic is used to represent a simple group of pieces of information. One may also include a picture within the graphic. To insert a picture, Aanchal should click on the ‘SmartArt Graphic’ icon from the ‘Illustrations’ group in the ‘Insert’ menu. The following dialogue box will appear. She can select the ‘Picture’ option from the options given on the left-hand side and choose one of her choice from the different types that will be displayed in the centre pane. She should press ‘OK’ once she is done. She can now manually type her text onto the graphic inserted. To insert a picture, she can just click on the icon in the graphic art and select a file from the system or the web.
Here is what one may look like.