What is Forecast in Excel?
When a user enters historical data, it can be used to predict how the statistics will look in the future. This option is known as ‘Forecast’ in Microsoft Excel.
In this module we will look at
- How to Create a Forecast
- How to Customize a Forecast
- Formulas Used in Forecast
Where to Find ‘Forecast’ in Microsoft Excel?
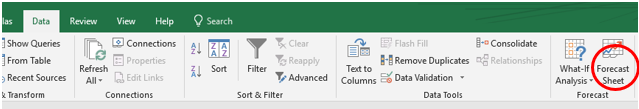
One can find the ‘Forecast Sheet’ option under the ‘Forecast’ group in the ‘Data’ menu, towards the left of the screen.
How to Create a Forecast in Microsoft Excel?
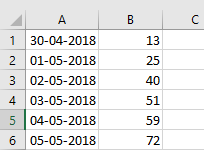
Step 1: Create a spreadsheet that has data in which a value corresponds to a date. Something like the one given below:
Step 2: Select this range of cells and click on the ‘Forecast Sheet’ option under the ‘Forecast’ group in the ‘Data’ menu.
The ‘create Forecast Worksheet’ dialogue box will appear.
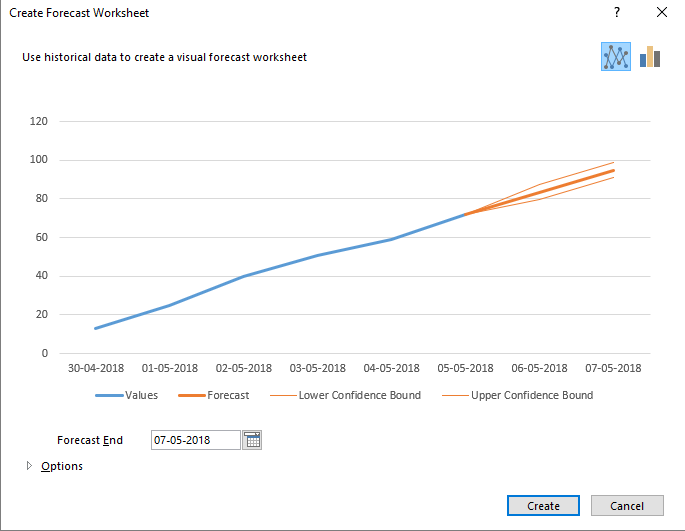
Step 3: Choose a date till which the forecast should be prepared in the ‘Forecast End’ textbox. Click on ‘Create’ once you are done.
You will find a new sheet in your workbook containing the given forecast as a table and a chart.
How to Customize Your Forecast in Microsoft Excel?
Step 1: Once you have created your forecast, click on the ‘Create Forecast’ option and click on ‘Options’ in the dialogue box that appears. Make sure that you are in the sheet that contains the forecast.
Step 2: Here you will find various options using which you can customize it:
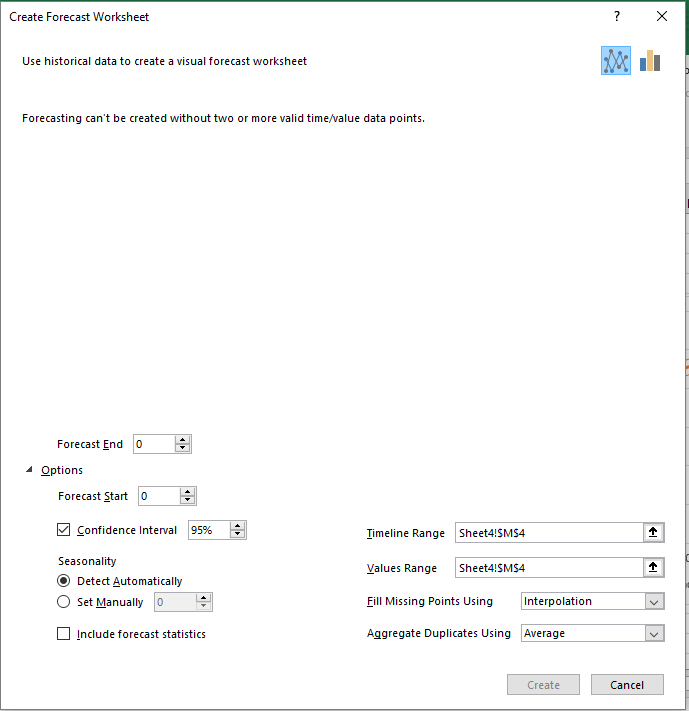
Forecast Start: You can give a forecast start date that is prior to the date from when you have values, much the same way as you selected a forecast end date.
Confidence Interval: This shows the extend to which the prediction is true. By default, this remains at ‘95%’ which you can change. A smaller interval will show you a higher probability. You can select or unselect this checkbox.
Seasonality: Seasonality is the frequency of the data. That is, for a monthly report, the seasonality will be 12. This is usually detected automatically, though you have the option of setting it manually.
Timeline and Value Ranges: you can change the range of cells used for the timeline and the values entered.
Fill Missing Points: Excel uses the method of interpolation to fill in details for points when this is missing. For example, if no data is available for a particular month in a year’s report.
Aggregate Duplicates Using: When you have entered multiple values for the same time period, MS Excel will use an average of these values to forecast.
Include Forecast Statistics: This is a small checkbox which can be selected in case you want additional statistical information of your forecast on top of the chart.
Formulas Used to Forecast in Microsoft Excel
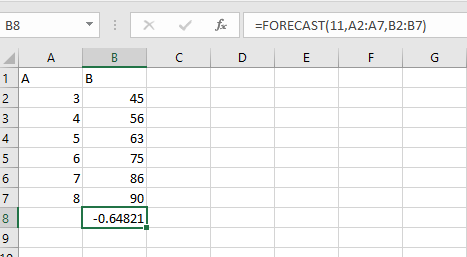
An alternative to using this method is to use a formula for forecasting the data. The formula to be used is
=FORECAST(x value for which you want to forecast, range of y cells where the value is known, range of x cells where the value is known)
For Example,
Example:
A teacher has made the following data in which the difficulty level of each Math examination over the years has been recorded from a scale of 1 to 10. How can a student predict how difficult the exam would be this year?
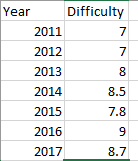
Solution:
A student should select this range of cells and click on the ‘Forecast Sheet’ option under the ‘Forecast’ group in the ‘Data’ menu. He/she should then type 2018 in the ‘Forecast End’ text box and click on ‘Create’ once they are done.