Here is the compilation of all previous year question of Data Interpretation – Quantitative aptitude with answers.
Below is the Bar Chart ( Question 1 – Question 4)
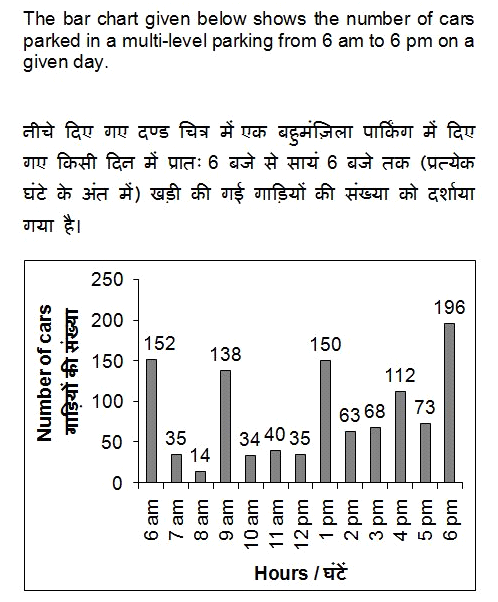
Question 1) What is the average number (approximately) of cars parked per hour from 6 am to 6 pm on the given day?[11-AUG-2017 Shift-2]
Options:
1) 80
2) 85
3) 73
4) 78
Correct Answer: 85
Question 2 )At what time the percentage change in number of parked cars is the maximum?[11-AUG-2017 Shift-2]
Options:
1) 9 am to 10 a
2) 12 pm to 1 p
3) 8 am to 9 a
4) 6 am to 7 am
Correct Answer: 8 am to 9 am
Question:3)For how many hours the number of parked cars is less than the average on the given day?[11-AUG-2017 Shift-2]
Options:
1) 5
2) 8
3) 6
4) 7
Correct Answer: 8
Question:4)If the charges of parking are Rs 50 per hour, then what is the total income (in Rs) from 6 am to 6 pm on the given day?[11-AUG-2017 Shift-2]
Options:
1) 55500
2) 50500
3) 57500
4) 59500
Correct Answer: 55500
Below Bar Chart ( Question 5 – Question 8 )
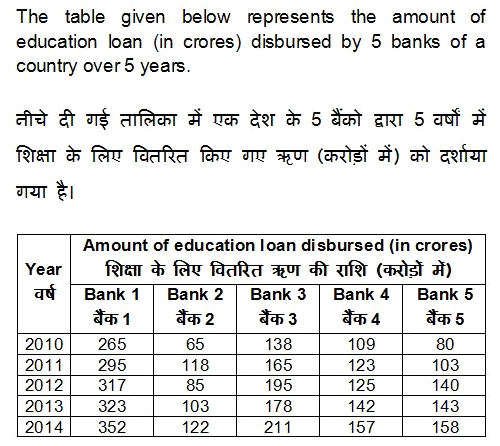
Question 5 ) What is the percentage increase in education loan disbursed by Bank 2 from 2010 to 2014?[11-AUG-2017 Shift-3]
Options:
1) 85.42
2) 87.69
3) 89.21
4) 83.18
Correct Answer: 87.69
Question:6)Which banks show a continuous trend of increase/decrease in loan amount disbursed over 5 years?[11-AUG-2017 Shift-3]
Options:
1) Bank 1 and Bank 4
2) Bank 1, Bank 4 and Bank 3
3) Bank 1, Bank 4 and Bank 5
4) Bank 4 and Bank 5
Correct Answer: Bank 1, Bank 4 and Bank 5
Question:7)What can be said about the two following ratios?[11-AUG-2017 Shift-3]
I. Loan amount disbursed by Bank 1 in 2011/ Loan amount disbursed by Bank 2 in 2014
II. Loan amount disbursed by Bank 3 in 2014/ Loan amount disbursed by Bank 4 in 2011
Options:
1) I > II
2) I < II
3) I = II
4) No relation
Correct Answer: I > II
Question:8)Which of the following is the correct order of percentage increase in loan amount disbursed by the given banks from 2010 to 2014?[11-AUG-2017 Shift-3]
Options:
1) Bank 3 > Bank 5 > Bank 2 > Bank 1 > Bank 4
2) Bank 2 > Bank 3 > Bank 5 > Bank 1 > Bank 4
3) Bank 5 > Bank 2 > Bank 3 > Bank 4 > Bank 1
4) Bank 2 > Bank 5 > Bank 4 > Bank 3 > Bank 1
Correct Answer: Bank 5 > Bank 2 > Bank 3 > Bank 4 > Bank 1
Below Bar Chart ( Question 9 – Question 10 )
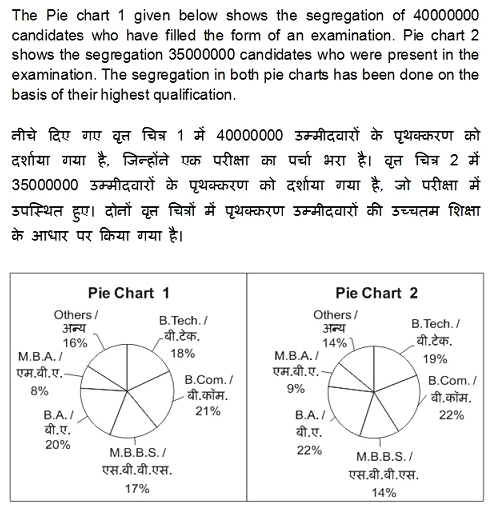
Question:9) 50% of others who have filled the form are B. Arch. and 45% of others who were present in the exam are B. Arch. How many B. Arch. candidates did not gave the exam?[12-AUG-2017 Shift-1]
Options:
1) 995000
2) 685000
3) 430000
4) 756000
Correct Answer: 995000
Question 10 )Which highest qualification accounted for most number of absentees?[12-AUG-2017 Shift-1]
Options:
1) B.A.
2) Others
3) B.com.
4) None of these
Correct Answer: None of these
Below Bar Chart ( Question 11 – Question 14 )
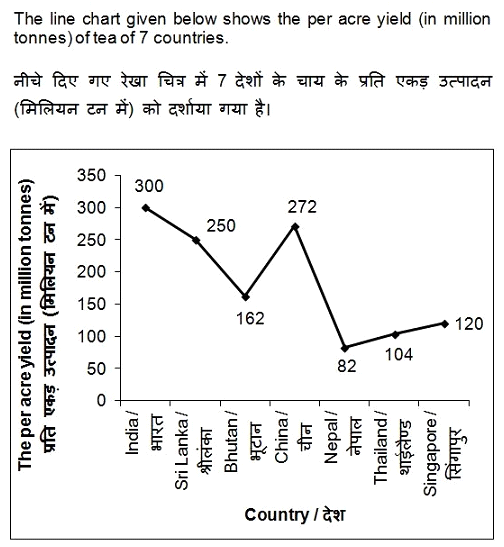
Question 11 ) What is average per acre yield (in million tonnes) of these 7 countries?[12-AUG-2017 Shift-2]
Options:
1) 163.14
2) 184.28
3) 146.78
4) 198.26
Correct Answer: 184.28
Question 12 )What is the respective ratio of average per acre yield of the 3 countries having the highest yield to average per acre yield of the 3 countries having the least yield?[12-AUG-2017 Shift-2]
Options:
1) 148 : 65
2) 201 : 149
3) 89 : 69
4) 137 : 51
Correct Answer: 137 : 51
Question 13) Total per acre yield of India and China is what percent of the total per acre yield of the remaining countries?[12-AUG-2017 Shift-2]
Options:
1) 44.34
2) 56.68
3) 83.24
4) 79.66
Correct Answer: 79.66
Question 14) All the countries are arranged in ascending order of per acre yield. If bottom 2 countries increases their per acre yield by 20% and all other countries increase their per acre yield by 10%, then what is the new average per acre yield (in million tonnes)?[12-AUG-2017 Shift-2]
Options:
1) 205.37
2) 210.82
3) 201.19
4) 199.26
Correct Answer: 205.37
Below Bar Chart ( Question 15 – Question 18 )
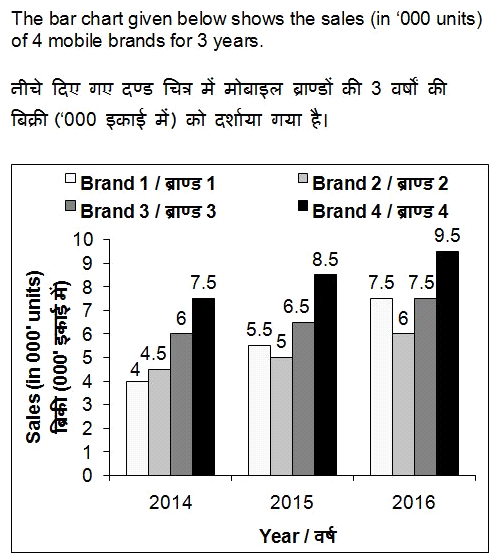
Question 15 ) What is the percentage increase in number of mobile sold by Brand 2 from 2014 to 2015?[12-AUG-2017 Shift-3]
Options:
1) 8.33
2) 33.33
3) 37.5
4) 11.11
Correct Answer: 11.11
Question 16 )What is the percentage increase in the total number of mobiles sold by these four brands from 2014 to 2016?[12-AUG-2017 Shift-3]
Options:
1) 42.16
2) 38.63
3) 32.43
4) 30.16
Correct Answer: 38.63
Question 17)In 2017 the sales of each brand increased by the same percentage as it did in the year 2016. What will be the approximate average sales (in units) of mobiles per brand in year 2017?[12-AUG-2017 Shift-3]
Options:
1) 9175
2) 8360
3) 9436
4) 9678
Correct Answer: 9175
Question 18)If for any year, the sales of a brand is more than average sales of these four brands in that year, then it gets a star. Which brand has the maximum stars?[12-AUG-2017 Shift-3]
Options:
1) Brand 3
2) Brand 3 and 4 both
3) Brand 4
4) All brands
Correct Answer: Brand 4
Below Bar Chart ( Question 19 – Question 22 )
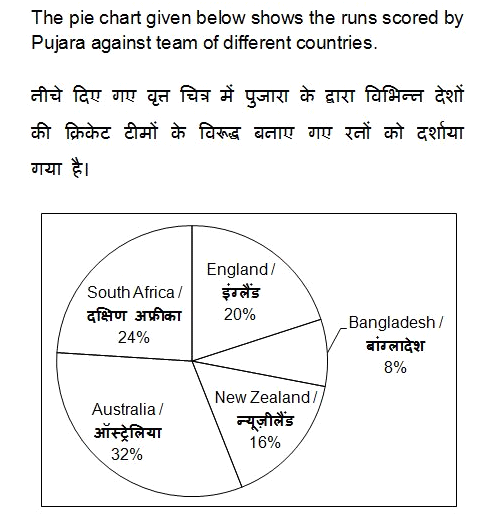
Question 19 ) The runs scored by Pujara against South Africa is more than runs scored against Bangladesh by what percentage?[16-AUG-2017 Shift-1]
Options:
1) 100
2) 150
3) 200
4) 250
Correct Answer: 200
Question 20 ) If Pujara has scored 1875 runs in total, then what is the difference in runs scored by Pujara against South Africa and New Zealand?[16-AUG-2017 Shift-1]
Options:
1) 150
2) 175
3) 200
4) 250
Correct Answer: 150
Question 21 ) What is the sectorial angle (in degrees) made by the runs scored against Australia in the given pie chart?[16-AUG-2017 Shift-1]
Options:
1) 106.8
2) 109.6
3) 112.4
4) 115.2
Correct Answer: 115.2
Question 22 ) What should be the least number of runs that Pujara must have scored in total (runs can only be integers)?[16-AUG-2017 Shift-1]
Options:
1) 25
2) 225
3) 375
4) 625
Correct Answer: 25
Below Bar Chart ( Question 23 – Question 26 )
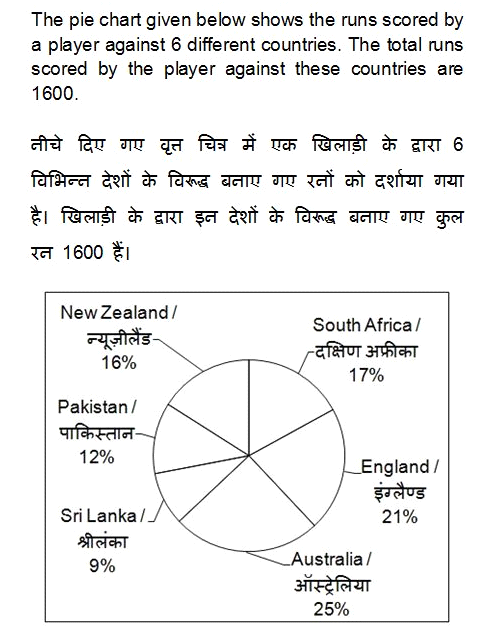
Question:23 ) How many runs has the player scored against Pakistan?[16-AUG-2017 Shift-2]
Options:
1) 272
2) 192
3) 256
4) 144
Correct Answer: 192
Question:24 ) The difference between the runs scored against England and Pakistan is same as the difference between which of the following two countries?[16-AUG-2017 Shift-2]
Options:
1) South Africa and Sri Lanka
2) South Africa and New Zealand
3) Australia and Sri Lanka
4) Australia and New Zealand
Correct Answer: Australia and New Zealand
Question:25) What is the difference in runs scored by the player against Australia and Sri Lanka?[16-AUG-2017 Shift-2]
Options:
1) 256
2) 128
3) 114
4) 80
Correct Answer: 256
Question:26) Difference between the total runs scored against Australia and New Zealand and the total runs scored against Sri Lanka and Pakistan make what sectorial angle (in degrees) in the pie chart?[16-AUG-2017 Shift-2]
Options:
1) 90
2) 144
3) 36
4) 72
Correct Answer: 72
Below Bar Chart ( Question 27 – Question 30 )
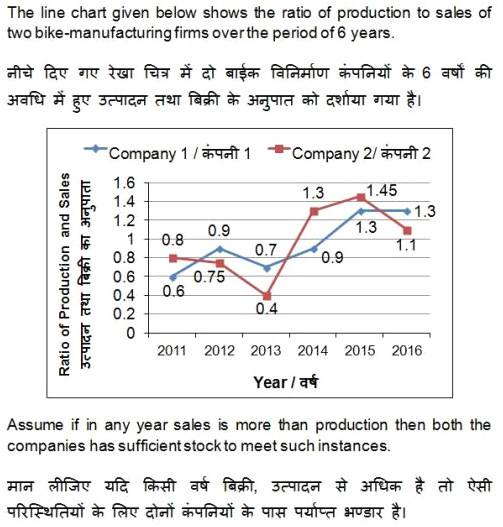
Question: 27) If the sales of company 1 in year 2015 was 50000 units, then what was its production (in units) in year 2015?[16-AUG-2017 Shift-3]
Options:
1) 38460
2) 45000
3) 52000
4) 65000
Correct Answer: 65000
Question: 28) The production of company 2 in year 2012 is 30000. If sales of company 2 in year 2012 and 2013 is same, then what was its production (in units) in year 2013?[16-AUG-2017 Shift-3]
Options:
1) 100000
2) 16000
3) 30000
4) 20000
Correct Answer: 16000
Question:29) The production of company 1 in year 2014 is 18000 and sales of company 2 in year 2012 is 15000. What is the ratio of difference in sales and production of company 1 in year 2014 and company 2 in year 2012 ?[16-AUG-2017 Shift-3]
Options:
1) 8 : 15
2) 7 : 16
3) 9 : 11
4) 3 : 8
Correct Answer: 8 : 15
Question:30) Company 1 sold 20000 bikes each year from 2011 to 2016 and company 2 sold 10000 bikes each year from 2011 to 2016. What is the difference (in units) in average yearly production of company 1 and 2?[16-AUG-2017 Shift-3]
Options:
1) 6733.33
2) 7500
3) 8666.66
4) 9333.33
Correct Answer: 9333.33
Below Bar Chart ( Question 31 – Question 34 )
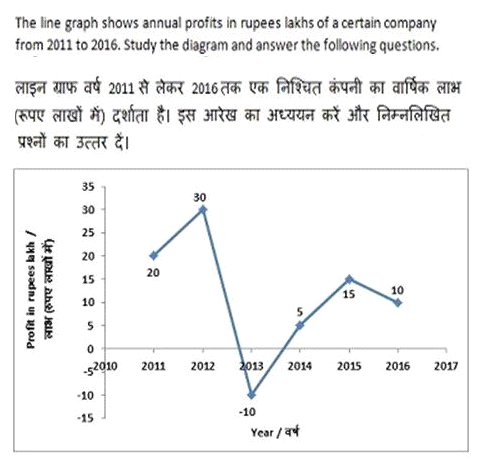
Question:31) The company reported a loss in which year?[17-AUG-2017 Shift-1]
Options:
1) 2013
2) 2016
3) 2012
4) 2014
Correct Answer: 2013
Question:32) What is the cumulative profits (in lakh Rs) earned by the company in the given six years?[17-AUG-2017 Shift-1]
Options:
1) 80
2) 70
3) 90
4) 100
Correct Answer: 70
Question:33) By what value profit in 2012 was more (in %) than the profit of 2011?[17-AUG-2017 Shift-1]
Options:
1) 10
2) 33.33
3) 50
4) 40
Correct Answer: 50
Question:34) If the profits are added to the company’s reserves and the reserves stood at Rs 150 lakhs at the end of 2015, what were the reserves (in Rs. lakhs) in the beginning of 2012?[17-AUG-2017 Shift-1]
Options:
1) 130
2) 90
3) 110
4) 40
Correct Answer: 110
Hope you find the question useful. Please share to help others.