Data interpretation is the process of analyzing data and providing solutions for the questions framed. It is the easiest topic where a candidate score the maximum number of scores in any exams like SSC CGL , Bank Po, IBPS clerk , SBI PO , CHSL or any other competitive exam.
Table of content
1) Value based data interpretation questions concepts
2) Bar Diagram data interpretation questions concepts
3) Graph based data interpretation questions concepts
4) Pie chart based data interpretation questions concepts
Understand all types of data interpretation in one go ,Let us dive into some questions.
Value bases Data interpretation questions
Question ) Salaries (in thousands) of five employees during the period of 2001 – 2005 is given. Interpret the data and answer the following questions based on it.
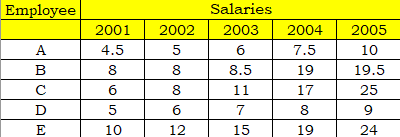
1) Who among A, B, C, D and E got a uniform increase in their salary throughout the five years?
Solution : The uniform increase means the difference between salaries in consecutive years should be same.if you subtract salaries of consecutive years , the difference is always 1 or same ,so D has uniform salary pattern.

Only D has a uniform increase of 1 from 5 to 6 and 6 to 7 and 7 to 8 and 8 to 9.
Ans: D
2) From 2002-2003, what is the percentage increment in salary of ‘C’?
Solution:
Here, we need to apply the golden formula of percentage. If you don’t know the golden formula then have a look below
![change in percentage formula = [ New value - old value ] /old value * 100](https://padhle.com/wp-content/uploads/2020/08/trickk-19.png)
Ans: 37.5 %
3) Who among A, B, C, D and E got a uniform increase in the increment of their salary throughout the five years?
Solution:
Uniform increase in the increment means that the change in the number is increasing in a uniform pattern.
See the below table and say which employee has a uniform increase in the difference in the salary.
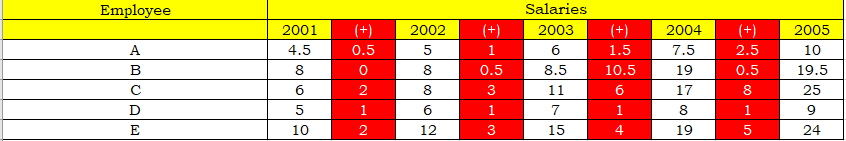
Only Employee E has a uniform increase while others don’t have a uniform increase.
Answer: E
4) Give the difference in increment obtained by A and E in during 2003–2004.
Solution: Let’s solve this question with the same above table.
The question is demanding the year between 2003 – 2004 and only A and E.
Let us find the increment.
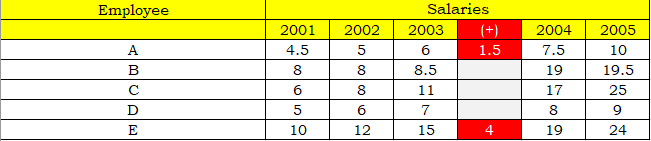
The difference in the increment for A during the year 2003 – 2004 is 1500
(Remember the salaries are in the thousands. Read the first line of the question)
The difference between E and A increment = 4000 – 1500 = 2500
Answer = 2500
5) Give the proportion of increments obtained by C and E during 2002–2003.
Solution: We need to find the increments of C and E only for the year 2002 – 2003.
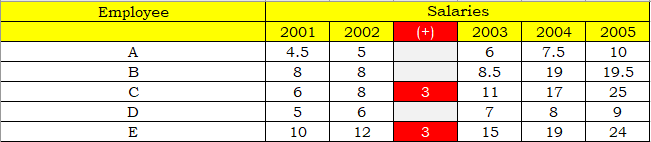
The difference in the increment for E is 3000
The ratio of the difference = 3000 : 3000 = 1 : 1
Answer = 1 : 1
Key Points
Analyze the data and try to answer the question , mostly question asked are easy to answer , and never leave this Data interpretation questions ever. This is one of the scoring area of the exam.
Question II. Percentage of literacy rates in five states is given:
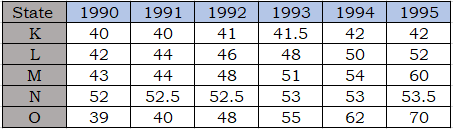
other rows representing the percentages.
1) Which state hasn’t shown an increase in its literacy rate in 1990–1991?
Solution: Check-in 1990 – 1991 column and see which doesn’t increase.
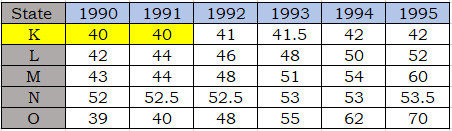
Answer: K
2) Which state has exhibited a tremendous increase in its literacy rate during 1990-1995?
Solution: To check which state has shown a tremendous increase we need to calculate via percentage. Let’s apply our golden formula of percentage.
If you don’t know about the formula , learn more about the percentage
Here below is the chart.

For each state we need to take 1990 value as Old Value and 1995 value as New Value.
![change in percentage formula = [ New value - old value ] /old value * 100](https://padhle.com/wp-content/uploads/2020/08/trickk-24.png)
It is certain to note that O’s % change is more than any other % change.
Answer: O
3) Which state exhibited a uniform increase in its literacy rate?
Solution: Uniform increase here means the difference between the number is same for all the years. Now, let’s check which state exhibited uniform increase in its literacy rate.
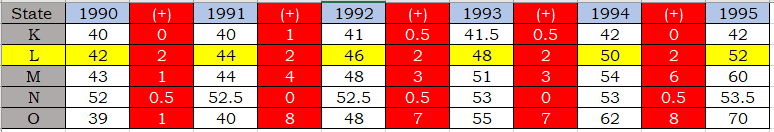
Only state L has shown a uniform increase all the years of value 2.
Answer: L
4) Give the difference in the increase in the percentage of literacy rate between state M and N during 1993-1994.
Solution: We need to check the difference between M and N state for the year 1993 – 1994 and then subtract it to get the answer.
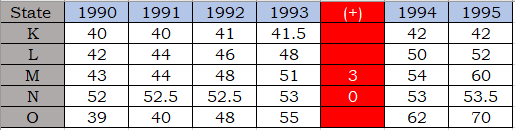
The difference in M = 3
The difference in N = 0
=> The difference between M and N = 3 – 0 = 3
Answer: 3
5) Give the ratio between the increase in the percentage of rates of L and M in the year 1992 – 1993?
Solution: We need to check the difference of L and M for the year 1992 – 1993.
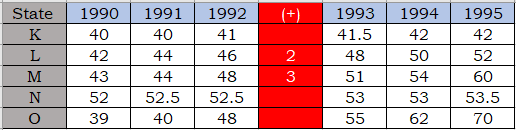
The difference for M is 3
Now, the ratio of L and M = 2 : 3
Answer: 2 : 3
Bar Diagram based Data Interpretation questions
Question ) Expenditure and income of five families in rupees:
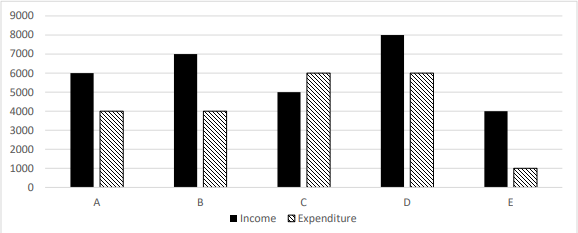
1) Which family spends more money than it earns?
Solution: If you could see the bar diagram there is only one family which sends more than it earns and it is C
Answer: C
2) Give the ratio between families with more income than expenditure and families with less income than expenditure.
Solution: The question wants to find out the ratio of families whose income more than expenditure with families whose income is less than expenditure.
There is only one family whose expense is more than income ie C.
While other families expense is less than income. There are 4 families whose expense is less than income.
Answer: 4 : 1
3) The income of D is how many times greater than that of income of E?
Solution: For this, we need to see the income of D and E.
As per the chart – The income of E is 4000
As per the chart – The income of D is 8000.
Now D is how many times greater than B = D/B = 8000/400 = 2
Answer: 2
4) Give the difference between average income and average expenditure of five families.
Solution: We need to find the average of income and expenditure.
Average income = Total income of all families / total number of families
Average expenditure= Total expenditure of all families / total number of families
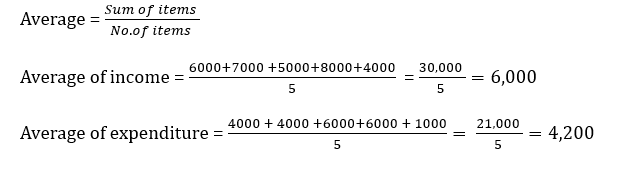
So, Average income = 6,000 and Average expenditure = 4,200
We need to find the difference between Average income and Average expenditure. So, => Difference = 6,000 – 4,200 = 1,800
Answer: 1,800
5) Income of family E is approximately what percent of the income of the family B?
Solution: To find the income of E is what percent of the income of B. We need to divide the income of E with the income of B.
Income of B = 7,000
Income of E = 4,000
Percent of X with respect to Y ?
Formula = [ X / Y ] * 100
Percent of E wrt to B = [ 4000/7000 ] * 100 = 57.14
Answer: 57.14%
Key point
Bar diagram questions are very easy ,just understand the graph visually and answer all questions.
Graph based Data Interpretation questions
Question ) Production percentage of three companies from 1990 – 1998
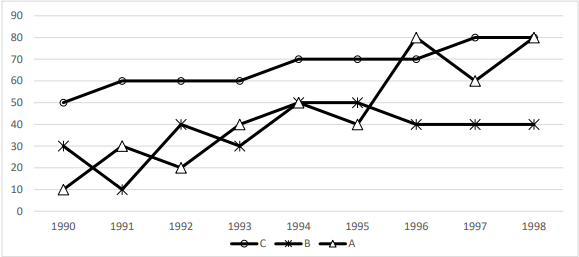
1) Which company exhibits maximum percentage of production in the year 1995?
Solution: Check in 1995 and see which company has the highest percentage. It is C and it has 70% of production.
Answer: 70%
2) Which of the following companies does not exhibit fall in percentage of production?
Solution: See the chart and say which graph doesn’t fall. A falls, B falls but C doesn’t fall.
Answer: C
3) Give the average percentage of production of company A.
Solution: We need to do the average of A.
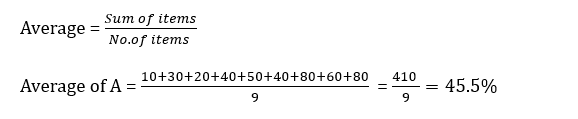
Answer: 45.5%
4) Give the difference between percentages of production of company A and B in 1991.
Solution: We need to see the chart and find the production of A and B in the year 1991.
As per the chart – Production of A during the year 1991 = 30
As per the chart – Production of B during the year 1991 = 10.
Difference = 30 – 10 = 20
Answer: 20
5) Give the year in which percentages of production of company A and company B coincide.
Solution: We need to see the chart. As per the chart, the production company A and B coincide(same) in the year 1994.
Answer: 1994
Pie Chart based Data Interpretation questions
Question ) Characteristics of foreign tourists visiting India during a given year.
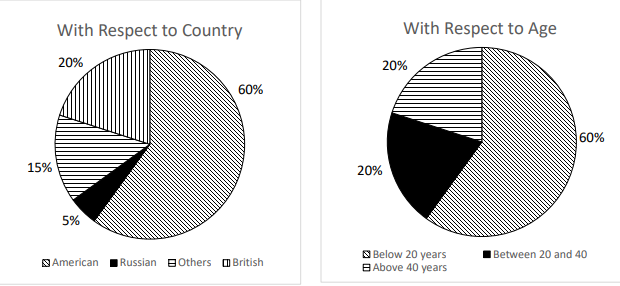
1) If in a given year 1,00,000 tourists visited India and the age-wise distribution data applies to all countries, the number of American tourists who visited India during the year and are in the age group of 20-40
years is:
Solution: We need to go step by step.
Step-1: Find the number of American tourists
Step-2: The Americans who are in the age group 20 – 40.
As per the chart, 60% are Americans who visited India.
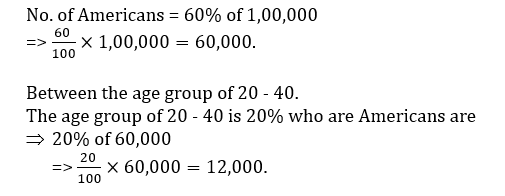
Answer: 12,000
2) With the same data given in the previous question, what would be the number of Russian tourists who are below 20 years of age?
Solution: We need to go step by step
Step 1: Find the number of Russians
Step 2: Find who are below 20 years of age.
As per the chart, 5% are Russians
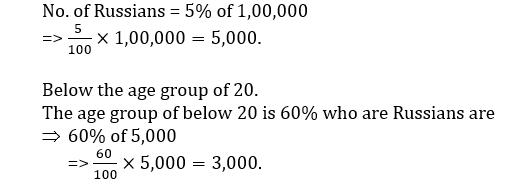
Answer: 3,000
3) With the same data given above, the number of British tourists between 20 and 40 years of age is:
Solution: We need to go step by step
Step1: Find the number of British
Step2: Find who are between the age group of 20 – 40.
As per the chart, there are 20 % areBritish
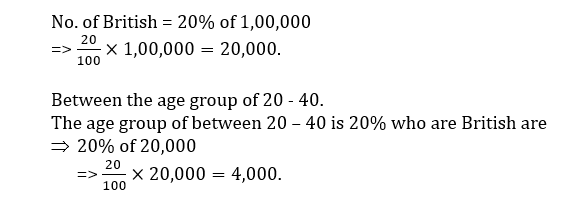
Answer: 4,000
4) With the same data, how many tourists were below 20 years, but are neither American nor Russian nor British?
Solution: We need to go step by step
Step1: We need to find the number of others
Step 2: We need to find others below the age of 20
As per the chart, the number of others is 15%
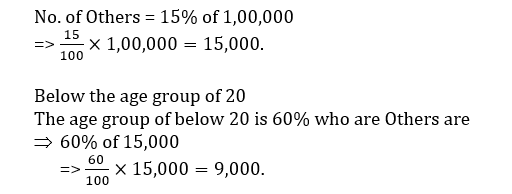
Answer: 9,000
5) What is the ratio of British tourists below 20 years to the Russian tourists above 40 years?
Solution: There are two portions of the above question.
The First portion to find the British tourist who is below 20 years.
The second portion to find the Russian tourist who is above 40 years.
First portion:
Step1: Find the number of British
Step2: Who are below 20 years of age.
As per the chart, there are 20% of the British.
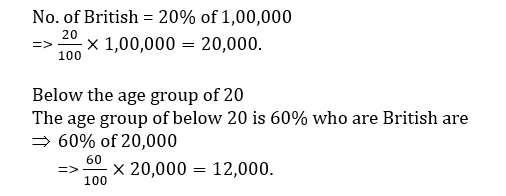
The first ratio part is 12,000
Portion 2:
Step1: Find the number of Russians
Step2: Find the age above 40
As per the chart, there are 5% of Russians.
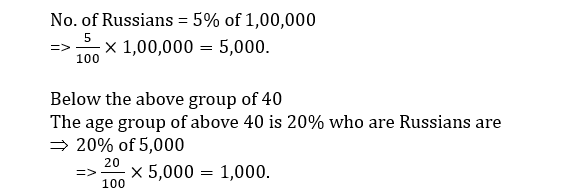
The second ratio part is 1,000
Ratio = 12,000 : 1,000 = 12 : 1
Answer: 12 : 1
So , the give away from this article is that never leave these question and try to attempt these questions first if you can.
Practice some Data interpretation questions now