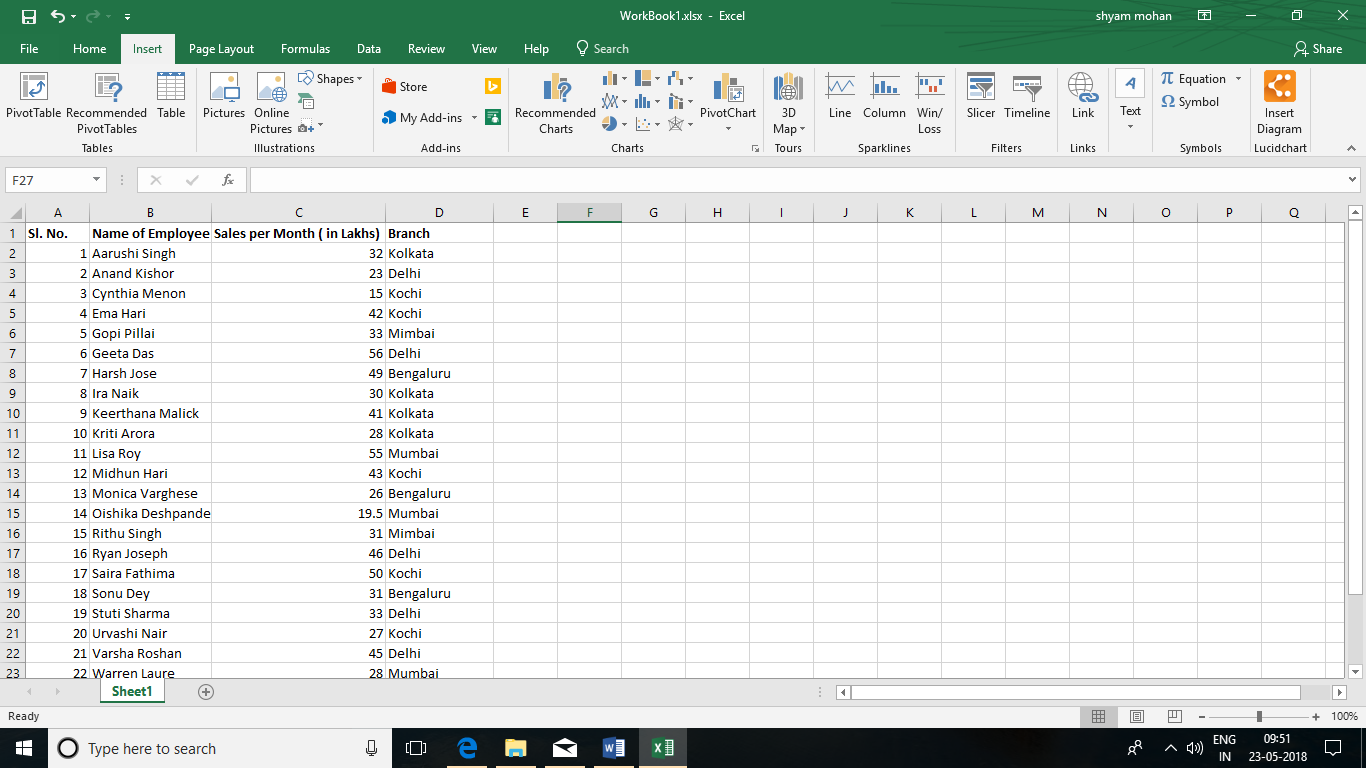
Sunil has the following spreadsheet that contains information about the productivity of 25 employees of his company from various branches across India.
What is a Pivot Table?
A pivot table is a summarized and consolidated table that contains complex data from all over the sheet and workbook. It doesn’t change any of the values in it original place but simply organizes them at one place for the user’s easy reference.
What is the Use of a Pivot Table?
Take the example of Sunil above. He has a lot of data in his spreadsheet and when he is looking at it to find a particular data, it would be difficult for him. All the complex data could confuse him. Instead, if he uses a Pivot Table, he can have a summary of his data and find what he is looking for easily. If he simply hovers his cursor on top of each value on the table, he can see how that value was obtained.
Where to Find the ‘Pivot Table’ option?
This option can be found in the ‘Tables’ group of the ‘Insert’ menu, towards the left-hand side.
How to Create a Pivot Table?
First, select a cell in the range of data and click on the ‘Pivot Table’ option from the ‘Tables’ group in the ‘Insert’ menu. The following dialogue box will appear.
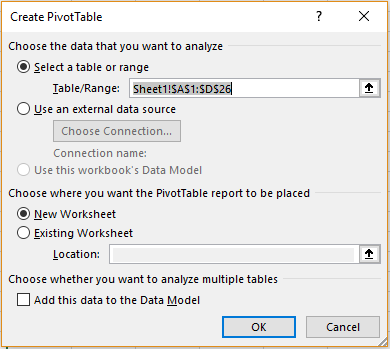
Excel will select the entire range to create the table in the ‘Table/Range’ textbox. He can change it if he wants.
By default, the location of the Pivot Table will be a New Worksheet. If he wants to change this, he can click on the ‘Existing Location’ option and select the range this should be inserted in. in the ‘Location’ textbox.
Check the box near ‘Add this data to the Data Model’ if he wants this to be included in it. Click ‘Ok’ once done.
The following pane will open on his right.
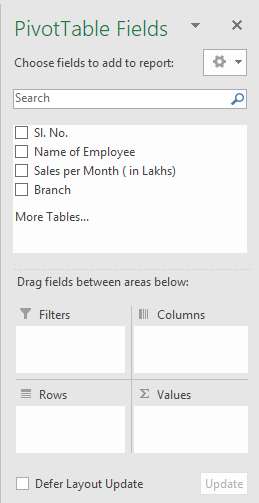 As Sunil wants to know the sales per month in each branch, he should select these options in the list.
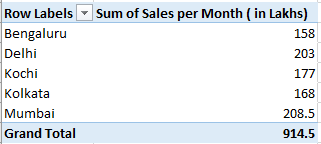
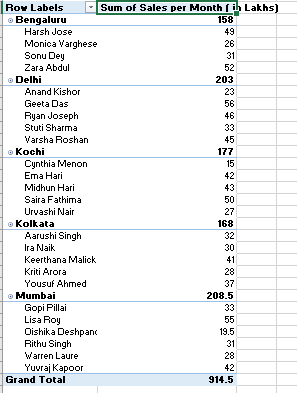
The Pivot Table will be created as follows.
Adding Fields to the Pivot Table Report
Suppose Sunil wants the table to have not just the information about branches but employees as well, he can add fields to this table by selecting the ‘Name of Employee’ option under the ‘Choose Fields to add to report’ heading from the pane.
Refreshing Pivot Table Reports
When Sunil sees the report, he observes that there is a mistake in the value entered for one of the employees. He changes it on the worksheet but this does not change the data for the Pivot Table. How can he deal with this? He can use the ‘Refresh’ option. To refresh the Pivot Table data, he should click on any cell from the table. The ‘Pivot Table Tools’ option will appear on the ribbon. Click on the ‘Analyze’ tab and then on the ‘Refresh’ button from the ‘Data’ group. From the dropdown list that appears, he can choose to ‘Refresh’ just the particular cell or ‘Refresh All’ to refresh all the cells on the workbook.
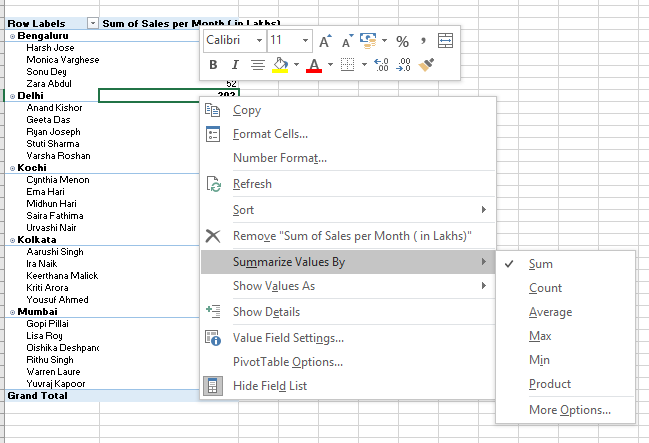
Changing the Summary Function
If at any point Sunil feels that what he wants is not the sum of the employee sales but an average of how much each employee’s sales, he can change this by changing the summary function. To change the summary function, he should right click on the cell containing the value whose summary function is to be changed and select the ‘Summarize Values by’ option in the dropdown list. A dropdown list containing the various functions will appear. He can choose ‘AVERAGE’ option from this.
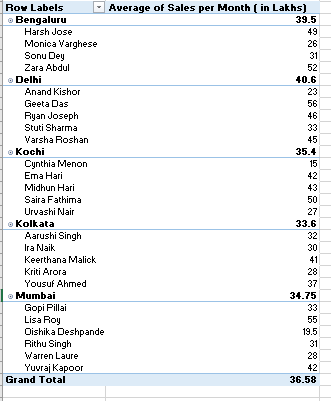
 The table will change as follows
Creating Report Filter Page
After he has done with these, he now wants to filter out data for each branch. He can do this as follows.
On the Pivot Table pane, he can drag the ‘Branch’ option from the ‘Rows’ group to the ‘Filter’ group. This will now create a filter option on the top of the table. On clicking the small dropdown arrow near this ‘Branch’ filter option, the various branches can be seen in the dropdown list.
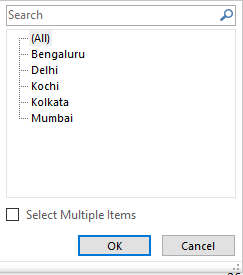
Supposing Sunil wants to view the filtered results for Bengaluru. he can select this option from the list. The results will appear as follows.
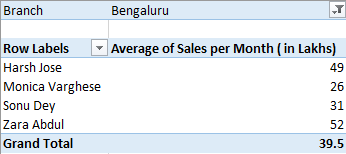 This way, using Pivot Tables, Sunil is able to do his work much easily.